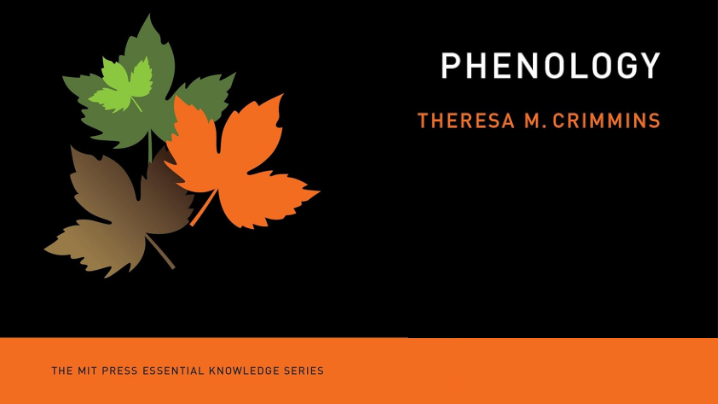
Flowering timing advancing in the Greater Yellowstone Ecosystem
Climate normals are 30-year averages of weather data that provide a baseline to compare current weather. NOAA recently updated this average to the most recent 3 decades - what does this mean for our maps of spring?
Normals are long-term average climate products - they exist so we can compare today's weather to the long term average - for example, to find out if this January is colder than "normal." Since temperatures have been rising decade by decade, the period of comparison matters in showing the difference between current conditions and “normal.”
The USA National Phenology Network laments the passing of Marjorie Helen Schwartz, a long-time lilac observer and mother of USA-NPN co-founder Mark D. Schwartz. Marjorie died peacefully on December 21, 2021 at the age of 93. She lived all her life in the Thumb of Michigan’s Lower Peninsula, an area shaped like that digit on a mitten which juts into Lake Huron. After she married Mark’s father, Donald J. Schwartz, in 1954, they lived in Gagetown, a small village in Tuscola County, where sugar refining, ethanol processing, and growing grains and beans dominate the local economy.
Some of our Nature' Notebook observers are reporting late season leaf out and flowering in lilacs this year. How uncommon is this late season phenology? Not too unusual, as the map shows.
Each summer, we deliver a Buffelgrass Pheno Forecast to aid managers in knowing where and when invasive buffelgrass is green across Southern Arizona. The forecast is based on known precipitation thresholds for triggering green-up to a level where management actions are most effective. In 2021, we added weather station-based forecasts of buffelgrass green up to the gridded forecasts to provide managers with additional data about rainfall.