Climate normals are 30-year averages of weather data that provide a baseline to compare current weather. NOAA recently updated this average to the most recent 3 decades - what does this mean for our maps of spring?
Normals are long-term average climate products - they exist so we can compare today's weather to the long term average - for example, to find out if this January is colder than "normal." Since temperatures have been rising decade by decade, the period of comparison matters in showing the difference between current conditions and “normal.”
Each time we enter a new decade, NOAA updates the suite of standard temperature products to the most recent 3-decade period. They recently moved from the 1981-2010 climate normal period to the 1991-2020 period. Even though ⅔ of the years are the same for the new period, the period of 2010-20 can make a large difference. Climate Central took NOAA's products a step further, showing how seasonal average temperatures have shifted from the prior to the current climate normal period.
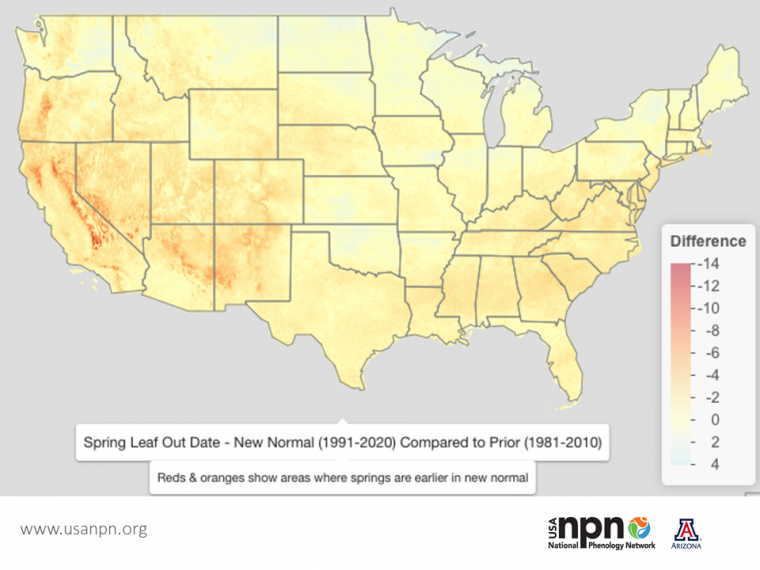
We just updated our spring leaf out and bloom maps to use the new 1991-2020 normal period. In most of the country, spring is coming earlier in the most recent 3 decades compared to prior normal period.
How does this relate to climate change? Climate change is best detected through long term (50+ year) trends in temperatures - as done here for the National Climate Assessment. However, looking at the difference between the start of spring in the two normal periods, we see what we'd expect with climate change: Spring is coming earlier in much of the country.
Keep following our Status of Spring page to see how spring leaf out and bloom unfold across the country.