Sections
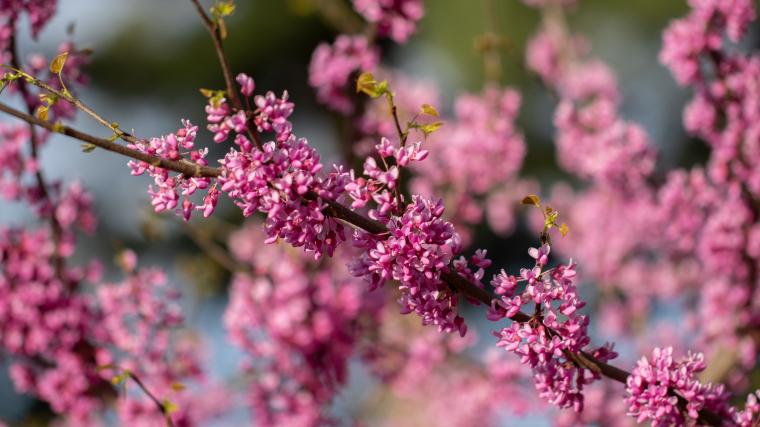
Nature’s Notebook data reveal how climate impacts flowering in eastern redbud trees
Sat, Jul 25, 2026
The appearance of bright pink flowers on eastern redbud trees is a reliable indicator that spring has arrived in the eastern U.S. However, the timing varies across the species’ range and not much is understood about the climate conditions that trigger flowering. A team of researchers used Nature’s Notebook observations from more than 150 sites across the eastern U.S. to identify how temperatures and daylength influence flowering in eastern redbuds. They used a novel modeling approach to show that both the amount of cold in winter and warmth in spring are important. However, the relative amount of cold and warmth needed to trigger flowering differed among sites. Trees in the north needed more cold and less heat to flower than trees in the south. Using these results, researchers can make accurate predictions about redbud flowering given recent climate conditions and better understand the potential impacts of climate change.
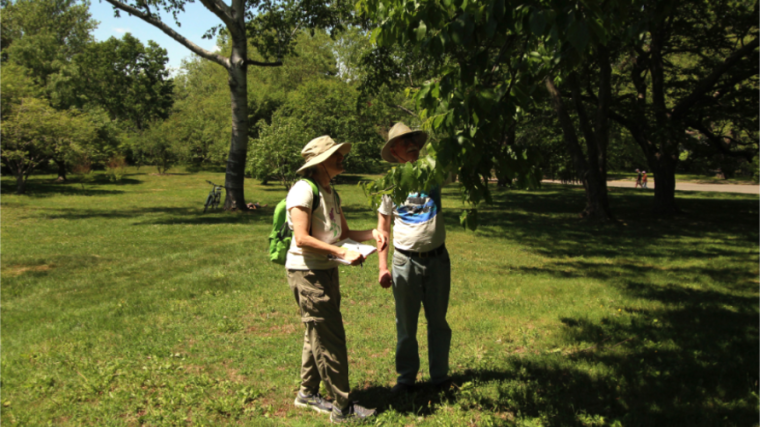
Observer Profile: Finding Connections through Nature - Tree Spotting in Urban Boston
Fri, Jul 24, 2026
In this Observer Story written by UCLA student Chloe Cheng, we learn about Nature's Notebook observers Beth and Kevin Mahar. Beth and Kevin are long-time observers with the Tree Spotters at the Arnold Arboretum in Boston, Massachusetts.
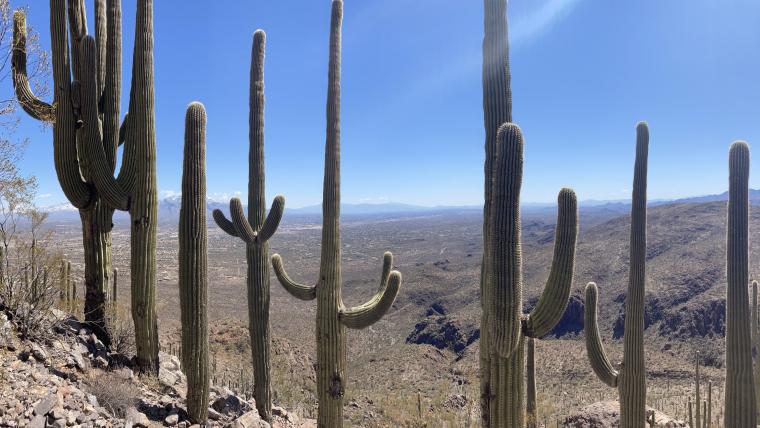
Join us at Botany 2026 in Tucson!
Thu, Jul 09, 2026
Are you attending the Botany Meeting in Tucson this August 1-5? We'll see you there! Come meet USA-NPN staff and students at our booth and talk to us about our new Nature's Notebook app (due out later this summer), the phenology data we have available, how to implement phenology monitoring with your undergraduate class or at your organization, and more!