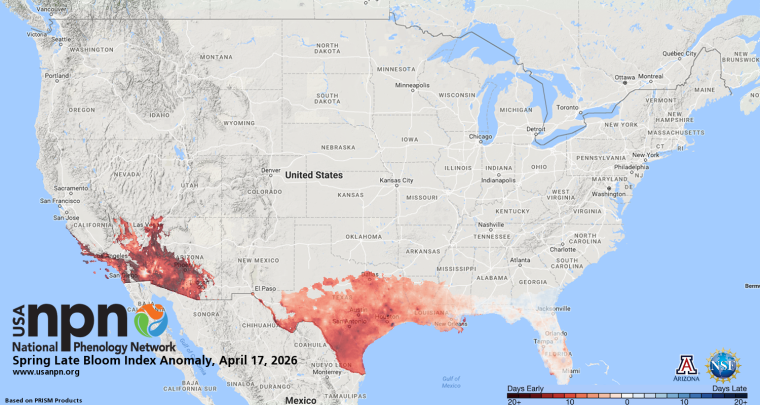
Introducing the Late Bloom Index!
We are excited to unveil another new index of spring – the Late Bloom Index!
Each year, people gather at Gobbler's Knob in Pennsylvania to hear Punxsutawney Phil's prediction of what the next six weeks of weather will bring. This year, Phil predicted six more weeks of winter! But what does the science say?
Each year, people gather to hear Punxsutawney Phil's prediction of what the next six weeks of weather will bring. This year, Phil predicted an early spring! But what does the science say?
Climate normals are 30-year averages of weather data that provide a baseline to compare current weather. NOAA recently updated this average to the most recent 3 decades - what does this mean for our maps of spring?
Normals are long-term average climate products - they exist so we can compare today's weather to the long term average - for example, to find out if this January is colder than "normal." Since temperatures have been rising decade by decade, the period of comparison matters in showing the difference between current conditions and “normal.”
Some of our Nature' Notebook observers are reporting late season leaf out and flowering in lilacs this year. How uncommon is this late season phenology? Not too unusual, as the map shows.
Punxsutawney Phil predicted six more weeks of winter! However, our maps of heat accumulation provide a more scientific look at how much heat has accumulated so far this year, and what's next.
Nature's Notebook observers reported some oddly-timed flowering for species across the country this fall.