Heat accumulation in the spring is commonly used to predict the timing of phenological transitions in plants and animals. This accumulation is typically reported in Growing Degree Days. The USA-NPN generates daily Accumulated Growing Degree Day (AGDD) maps using a January 1 start date and two base temperatures, 32°F and 50°F. The left map below shows the accumulation of Growing Degree Days since Jan 1 of the current year, using a 32°F base temperature. The right map below shows the anomaly, or how many more or fewer Growing Degree Days have accumulated this year compared to the 30 year average (1991-2020).
AGDD

AGDD ANOMALY

In many plants and animals, phenological transitions – especially those in spring – happen when enough warmth has accumulated. This warmth is often measured using growing degree days (GDDs). Growing degrees days are defined as the number of degrees the average daily temperature exceeds a base temperature, or the temperature below which the organism will remain in dormancy. Growing Degree Days are calculated as:
GDD = ((Tmax + Tmin)/2) - Tbase
If the average temperature for a day is lower than the base temperature, then no Growing Degree Days are counted.
Growing Degrees are accumulated daily, following a specified start date, by adding each day’s total to all previous days’ totals.

How are GDDs used?
For many plants and animals, there is a specific number of growing degree days that must be accumulated to trigger a change in phenological status such as budburst in plants or egg hatching in insects. These are referred to as growing degree thresholds. If a growing degree threshold for a phenological transition in a particular organism is known, it is possible to assess how soon that transition is likely to be reached, by calculating accumulated growing degree days (AGDDs) over the course of the season.
Use of maps and data
Recommended citation
Format: USA National Phenology Network. [Year Published] [Dataset Title] {as of [DOY] (for continuous daily data) | Year(s) [Year(s)] (for annual products) | Date [Date] (for daily products) } for Region [Coordinates]. [Parameterized URL for Data Download] USA-NPN, Tucson, Arizona, USA. Dataset Accessed [Date of Access] at http://dx.doi.org/10.5066/F7SN0723.
Example: USA National Phenology Network. 2017. Daily Temperature Accumulations - 32 Base Temp as of 2017-08-02. Region: 49.9375,-66.4791667,24.0625,-125.0208333. http://data.usanpn.org/geoserver-request-builder?service=wms&layer=gdd:a... . USA-NPN, Tucson, Arizona, USA. Data set accessed 2017-8-2. http://dx.doi.org/10.5066/F7SN0723
Data
The USA-NPN is currently generating provisional daily Accumulated Growing Degree Day (AGDD) maps using a January 1 start date and two base temperatures, 32°F and 50°F.
Accumulated Growing Degree Day maps can be explored in the USA-NPN Visualization Tool.
Download map images (.png, .gif, .pdf, etc) or raster data files from the Geoserver Request Builder page.
Raster data files can also be accessed via the USA-NPN Geoserver instance. Available products include:
- Contemporary (daily, current year) and 6-day forecast maps of Accumulated Growing Degree Days (AGDD) - available for 2016 and 2017
- Daily anomaly maps of AGDD, generated by comparing current day maps to 30-year (1991-2020) averages
- Daily 30-year (1991-2020) average temperature accumulations
- Daily Tmin and Tmax values for the current year
Download Data Using the USA-NPN Geoserver Request Builder
- Raster Data Files (GeoTiff, ArcGrid, NetCDF)
- Map Image Files (PNG, TIF, GIF, PDF)
Web Services Available via the USA-NPN Geoserver (geoserver.usanpn.org/geoserver/wms? request=GetCapabilities)
Visualize the Data Using the USA-NPN Visualization Tool
Additional documentation
Daily Accumulated Growing Degree Day and Spring Index Maps information sheet
Map Products Documentation: Crimmins, T.M., R.L. Marsh, J. Switzer, M.A. Crimmins, K.L. Gerst, A.H. Rosemartin, and J.F. Weltzin. 2017. USA National Phenology Network gridded products documentation. U.S. Geological Survey Open-File Report 2017–1003. DOI: 10.3133/ofr20171003.
Crimmins, T.M. 2018. The USA National Phenology Network’s growing degree day maps and online visualization tool support management decisions. Journal of Extension. 56: 3, 3TOT4. www.joe.org/joe/2018june/tt4.php
Estimating uncertainty in AGDD Products
The USA-NPN is committed to reporting measures of uncertainty, where possible, to support the use of these data products in decision making.
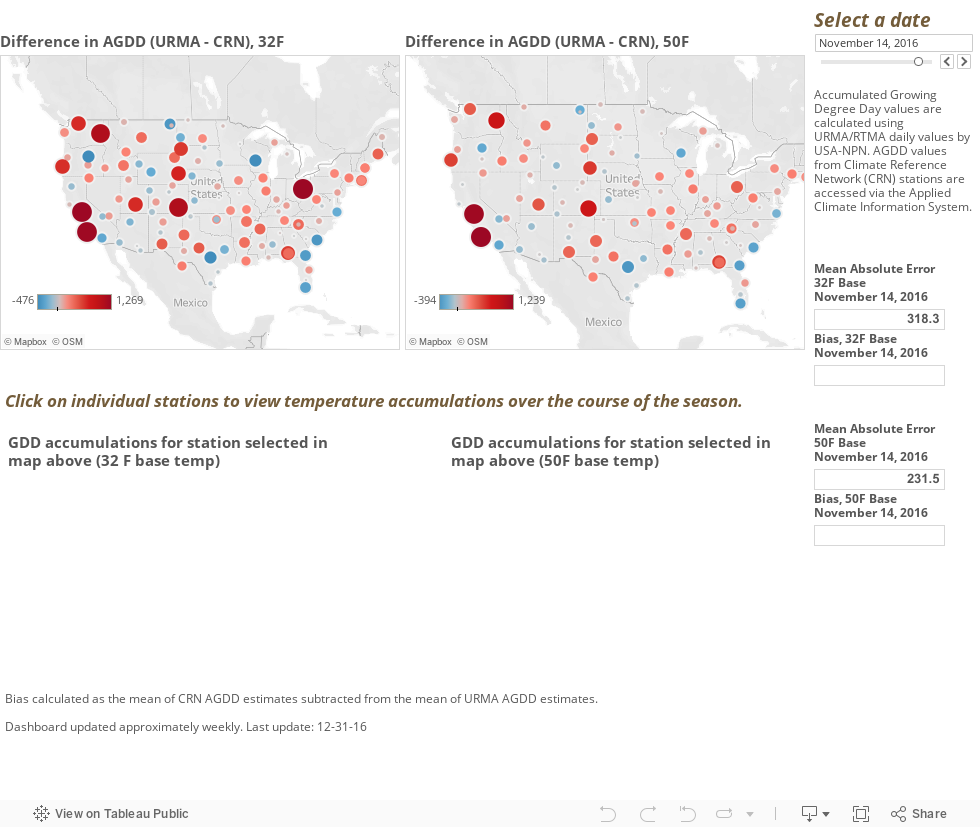
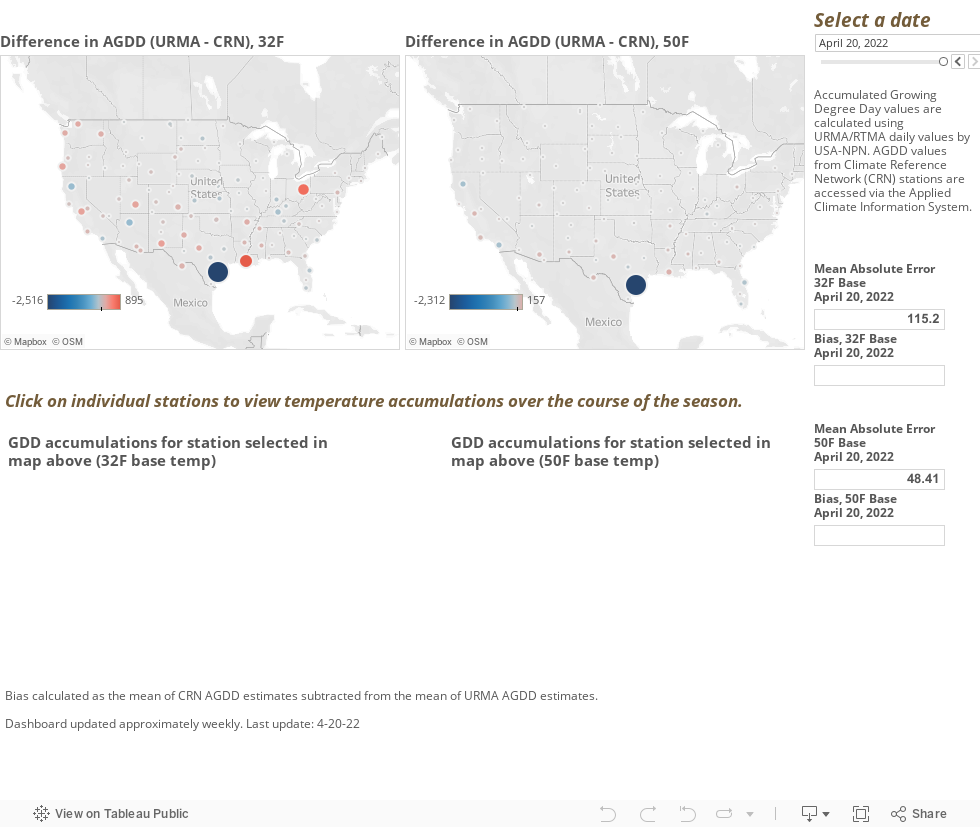
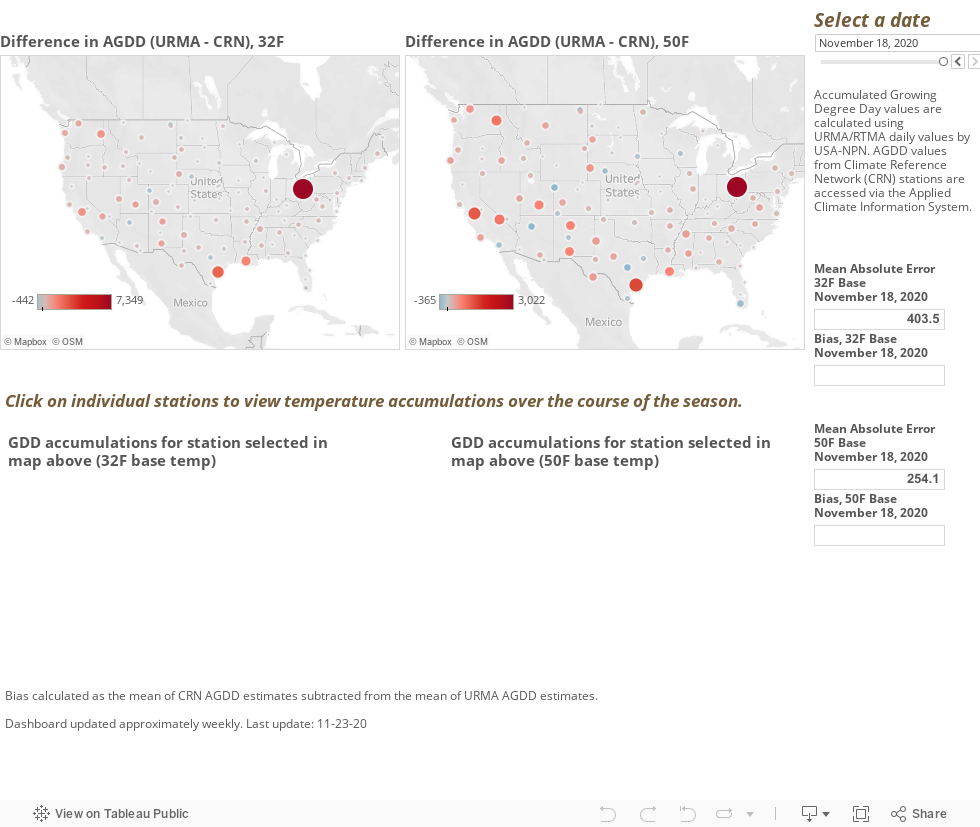
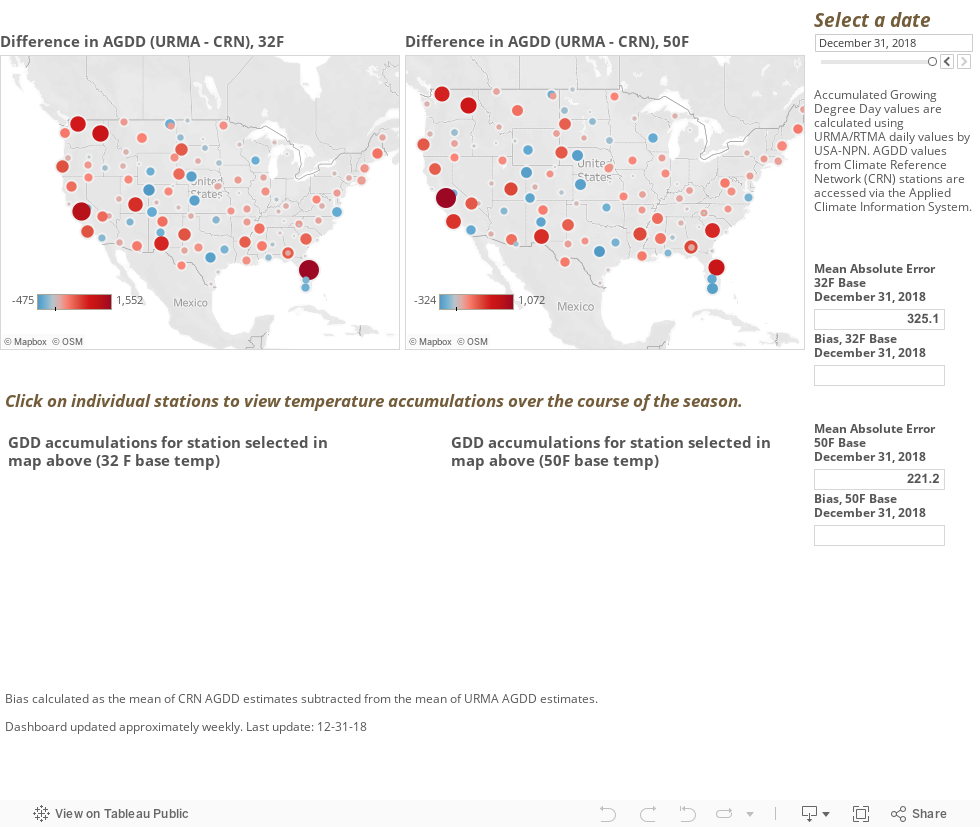
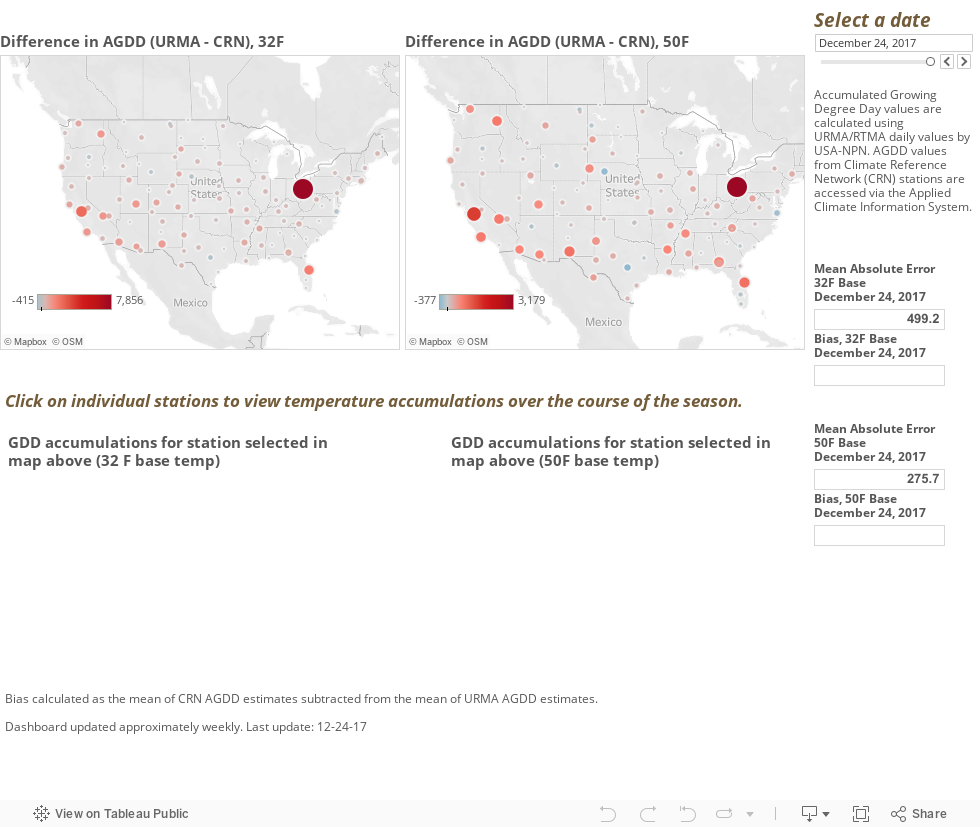
To assess the level of uncertainty in the USA-NPN AGDD products, we compare our URMA/RTMA-based calculations of Accumulated Growing Degree Days to those made using measurements from U.S. Climate Reference Network stations, accessed via the Applied Climate Information System, in the AGDD Uncertainty Assessment Dashboard.
The U.S. Climate Reference Network (CRN) stations, serve as the "unimpeachable record" of surface climate over the United States” (Diamond et al. 2013, Oswald and Dupigny-Giroux 2015). We compare our URMA/RTMA-based calculations of Accumulated Growing Degree Days to those made using measurments from CRN stations, accessed via the Applied Climate Information System, in the dashboards below.
2022 Comparisons
2021 Comparisons
2020 Comparisons
2019 Comparisons

2018 Comparisons
2017 Comparisons
2016 Comparisons