Brown rot, caused by several fungi in the genus Monilinia, has adverse impacts on stone and pome fruits—including peach, plum, nectarine, apricot, cherry, apple, pear, and quince—worldwide.
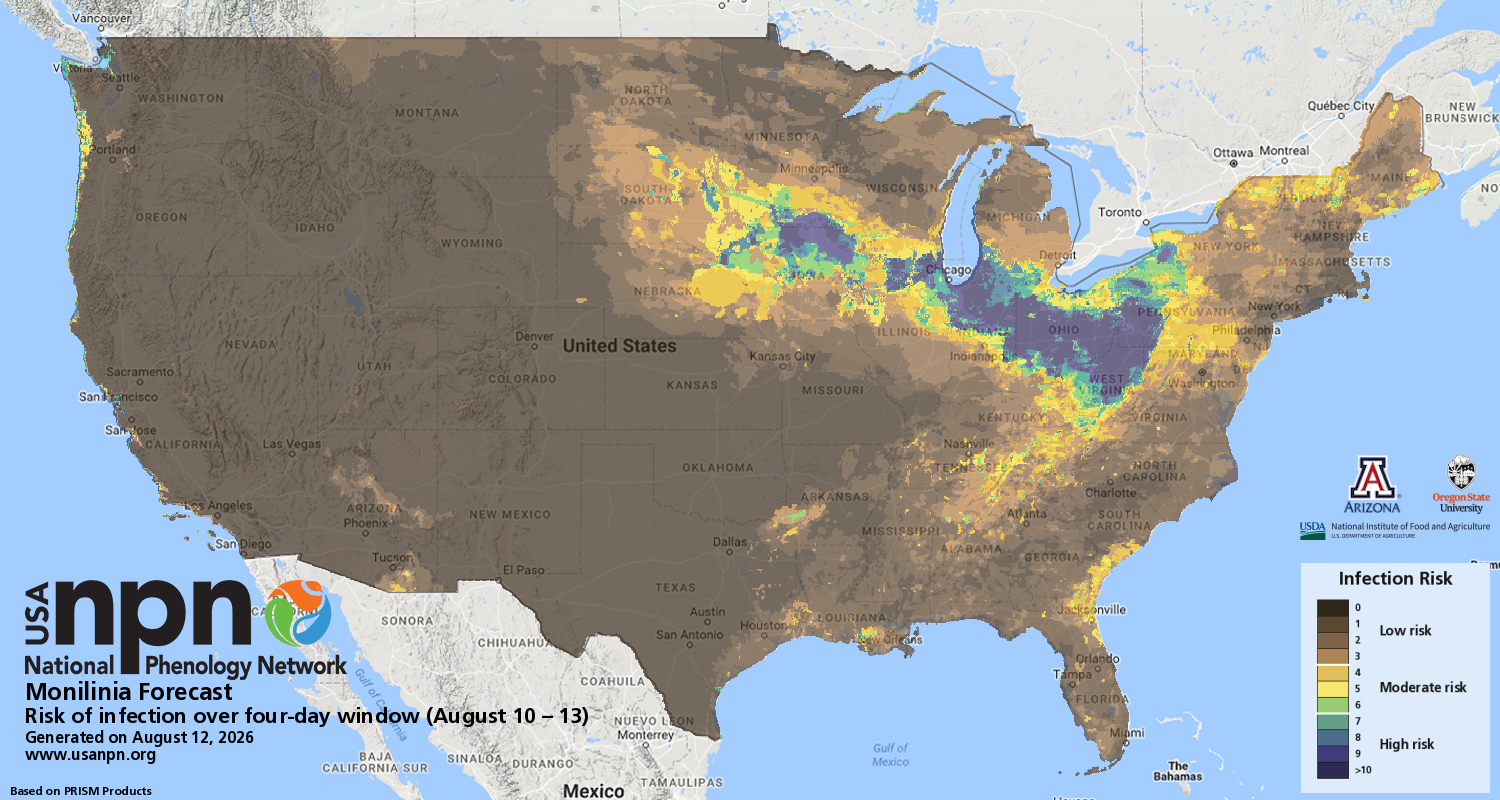
Monilinia Risk of Infection Over 4-Day Window
WHAT ARE PHENO FORECASTS?
Pheno Forecast maps predict key life cycle stages in invasive and pest species, to improve management efficacy. For pest species, Pheno Forecasts are based on published growing degree day (GDD) thresholds for key points in species life cycles. These key points typically represent life cycle stages when management actions are most effective. For Monilinia, we forecast daily risk of infection for the full calendar year. Watch a video on how to use the Monilinia Pheno Forecast.
Help us improve these maps! Our Pheno Forecast map products are still in development, and we seek input on their performance in your area. Give your feedback at the bottom of the page.
SIGN UP FOR PHENO FORECAST NOTIFICATIONS!
Sign up to be notified by email approximately two weeks and again six days ahead of key growing degree day thresholds for species of interest at your location

SPECIES BACKGROUND
In North America, brown rot is primarily caused by Monilinia fructicola, with M. laxa also present in some regions. The disease affects a wide range of Prunus species—such as peach, cherry, plum, apricot, and nectarine—and is considered one of the most destructive diseases of these crops. Some Monilinia species affect pome fruits, including apple, pear, and quince. This forecast applies primarily to M. fructicola and to M. fructigena, which is the species present in Europe that attacks pome fruits and may at some point become invasive to the U.S. Brown rot infections occur in response to favorable temperatures during periods of sufficient moisture in the form of rainfall, dew, and high humidity during bloom, fruit development, and near harvest, with symptoms often appearing rapidly. Infection can occur during periods of sufficient moisture over a wide temperature range, from 33 to 93F, with an optimum of 77F. Left unmanaged, the disease can spread quickly between fruits, reducing both yield and fruit quality.
LEARN HOW TO OBSERVE PHENOLOGY OF MONILINIA
Our learning module walks you through how to identify brown rot caused by Monilinia, how to report it, and why you should care.

RISK OF INFECTION FORECAST
We forecast daily risk of Monilinia infection over a four-day cumulative window based on the recent (prior two days) and forecasted (future two days) temperature and moisture conditions (Coop and Barker 2026). To interpret these risk forecasts, one should consider both the relative susceptibility of the current stage and cultivar and whether disease inoculum may be present. For example, the bloom period in an orchard that has had disease in recent months or years can be a very susceptible time for new infections to occur if the risk model indicates that the environmental conditions are favorable. The forecasts are available for the contiguous United States only.
Understanding when brown rot infections are most likely to occur can help growers, land managers, and home fruit producers make more informed decisions about when to take management actions such as applying chemical treatment, pruning trees, or removing infected fruit. For specific information on preferred treatment options in your region, we recommend contacting your local extension agent. For more information on treatment guidance, visit University of Florida IFAS Extension’s Brown Rot of Stone Fruit.
EXPLORE THIS FORECAST
Learn more about this forecast using our visualization tool!
The development of this forecast was funded primarily by USDA NIFA AFRI TSAB Award #2022-68013-37138 to support agricultural biosecurity.
More information on map development and re-use policy.